 In November 2012, I invested $10,000 into person-to-person loans split evenly between Prosper Lending and Lending Club, both out of curiosity and for a chance at higher returns from a new asset class. After diligently reinvesting my earned interest into new loans, I stopped my after one year (see previous updates here) and started just collecting the interest and waiting see how my final numbers would turn out at the end of the 3-year terms.
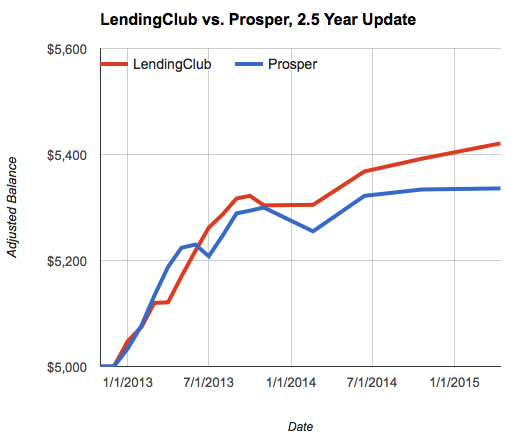
My last update was 6 months ago, so here’s what things look like after roughly two and a half years. This will be my last update before final liquidation of my portfolio (see recap below).
$5,000 LendingClub Portfolio. As of April 14, 2015, the LendingClub portfolio had 129 current and active loans remaining with a principal value of $1,003 (1 in grace period). 96 loans were paid off early and 29 were charged-off . 1 loan is between 31-120 days late and 2 are in default, which I will assume to be unrecoverable ($37.07 in principal). $417.94 in uninvested cash is left in the account, and I also withdrew $4,000 previously (payments and interest). Total adjusted balance is $5,421.

$5,000 Prosper Portfolio. My Prosper portfolio now has 110 current and active loans with a principal value of $1,404. 114 loans were paid off early, 42 charged-off. 1 loans are between 1-30 days late ($22). 3 are over 30 days late, which I am going to write off completely (~$18). $410.26 in uninvested cash is left in the account, and I also withdrew $3,500 previously (payments and interest). Total adjusted balance is $5,336.

Experiment Recap and Conclusions
- P2P lending has successfully gone mainstream. The fact that institutional investors are buying a significant portion of Prosper and LendingClub loan inventory would seem to prove that the concept is viable. This WSJ article says 66% of Prosper loans in 2014 had been sold to institutional investors. What started out as the Wild West of unsecured loans is now accepted by Wall Street. LendingClub had a successful IPO in December 2014 (which they generously let their lenders participate in).
- LendingClub reports my adjusted* annualized returns as 4.30% annualized. Prosper reports my annualized returns as 4.10% annualized. These returns are certainly above that of a savings account or bank CD, but not as good as many other asset classes over the same period. Considering the weighted average interest rate on those loans was 12% for LendingClub and 14% on Prosper, I saw a lot of defaults. (*Adjusted means you assume all loans 30+ days late will be total losses.)
- My reported returns consistently deteriorated as my loans aged. 10 months ago Prosper said my returns were 5.76%. 14 months ago Prosper said my returns were 7.55%. LendingClub reported my unadjusted annualized return 6 months ago as as 5.27%. 10 months ago, it was 5.94%. The lesson here is that your returns will continue to vary and likely deteriorate as your loans age, so don’t assume your returns will always stay the same as they are in the beginning. Also, your returns will look higher if you keep reinvesting into new loans.
- I am not a good loan picker. But will you be better? My returns are below average when compared to the advertised historical numbers. Certainly, I have seen reported numbers from other people who have done much better. Who knows, you may be the next P2P Bond King! 🙂 But I took my shot, diversified into over 400 loans, and here are my honest results. Not everyone who gets bad returns is willing to share about them.
- For small-time individual investors, dealing with unfamiliar forms at tax time can be tedious and time-consuming. Dealing with the tax forms each year isn’t impossible, but it isn’t fun either. If I were to invest all over again, I would definitely do it within an IRA to avoid tax headaches. To save more time, I would also buy at least 100 loans x $25, which also happens to be the $2,500 minimum for free auto-investment at LendingClub (no minimum at Prosper).
- I plan on liquidating the rest of my portfolio by the end of 2015. In June 2014, I still had $5,493 of principal in active loans in both LendingClub and Prosper. (The rest was idle cash, mostly withdrawn.) Now, roughly 10 months later, I only have $2,407 in principal and my total balance grew by a measly $67. $67 dollars! After filing my 2014 tax returns, I decided it was not worth the headache of dealing with the 1099s involved with these little loans. Thus, I plan on selling my remaining notes on the secondary market, probably soon but definitely by year-end. I might try again in the future inside an IRA, but for now I choose simplicity.
- LendingClub vs. Prosper relative performance. I tried my best to invest at both websites with the same criteria and overall risk preference. As noted, my LendingClub reported returns (4.3%) are a bit higher than my Prosper reported returns (4.1%). This is also supported by my own balance updates, although I wouldn’t put too much importance on the absolute numbers as I stopped reinvesting into new loans after the first year. Here’s an updated chart:

 Here’s a reader question that arrived this week:
 Many people feel more comfortable with someone else helping them with their finances. A common piece of advice these days is to find a fee-only advisor that doesn’t work on commission. Many times this leads to a recommendation of the National Association of Personal Financial Advisors (NAPFA), whose members must promise to be fee-only and act in a fiduciary manner (putting your interests first). They are regularly mentioned in Kiplinger’s magazine, and I’ve even referred a few readers to their website myself. You’d think that putting your money with the president of NAPFA would be a sound idea, right?
 Here’s another data point on the debate on how often to rebalance your portfolio to your target asset allocation.

 Quick question – What was the highest value ever for your investment portfolio? Now, what was the value exactly a year before that? You probably know the answer to the first question, but not the second, even though both have little to do with your final portfolio value.
 The
The 

 I like seeing my dividend income roll in each quarter, as do many other investors. But are mutual funds artificially “juicing” their reported dividend yields to attract investors? This is explored in a recent academic paper
  We’ve all heard of the power of compound interest. We’ve all heard of Benjamin Franklin. But have you heard of the story where Ben Franklin let his money compound quietly for 200 years? Here’s an excerpt from the book
  The Best Credit Card Bonus Offers – 2026
 Big List of Free Stocks from Brokerage Apps
 Best Interest Rates on Cash - 2026
 Free Credit Scores x 3 + Free Credit Monitoring
 Best No Fee 0% APR Balance Transfer Offers
 Little-Known Cellular Data Plans That Can Save Big Money
 How To Haggle Your Cable or Direct TV Bill
 Big List of Free Consumer Data Reports (Credit, Rent, Work)