 The wealth management group Del Monte published a whitepaper on Solo 401k plans, calling it the “financial industry’s best kept secret” and a “powerful and underutilized” retirement plan for self-employed business owners. The 4-page PDF does a good job at summarizing the benefits of a Solo 401k, aka Self-Employed 401k. Perhaps most importantly, the Solo 401k allows the maximum annual tax-sheltered contribution (or ties for the max) for all income levels and ages.

Here’a a quick benefit comparison against the SEP-IRA and SIMPLE IRA:

The key difference is the Solo 401k allows an $18,000 salary deferral at any income (i.e. if you make $18k or under, you can put aside all of it) for 2017 and then adds on a profit-sharing component. In addition, Solo 401ks a larger additional “catch-up” contributions at age 50.
I’ve had a Self-Employed 401k through Fidelity for several years, and I have been quite happy with it. The paperwork has been minimal, although you must start filing IRS Form 5500-EZ once your asset exceed $250,000 or face significant penalties. (It’s one page long.) It has been quite flexible – I am able to purchase mutual funds, ETFs, individual stocks, CDs, and individual Treasury and TIPS bonds. There is no annual fee and I’ve only had to pay trade commissions. Fidelity also accepts rollovers from outside IRAs and 401k plans.
Vanguard, Schwab, and TD Ameritrade also offer cheap in-house Solo 401k plans that work well for low-cost DIY investors. There are now several independent providers with “custom” 401k plans which can offer features like 401k loans the ability to invest in alternative asset classes (precious metals, tax liens, real estate, private equity, etc.) at additional cost. Vanguard and TD Ameritrade offer a Roth option; Fidelity and Schwab are only available with “traditional” pre-tax contributions.
Another option to consider is the Solo Defined-Benefit Plan, or “Solo Pension”. The annual maintenance fees are higher and the IRA requirements are significantly more complex, but you can make much larger amounts of tax-deferred contributions (dependent on age and income). The most affordable option appears to be the Schwab Defined-Benefit Plan. If anyone has any experience with this plan, I’d like to hear about it and would be open to a guest post.


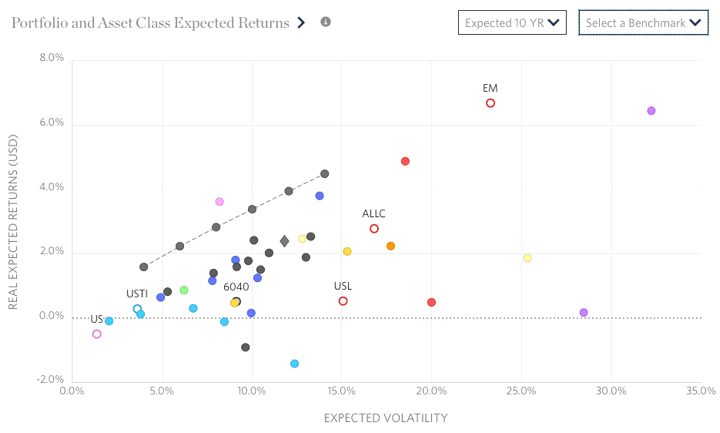
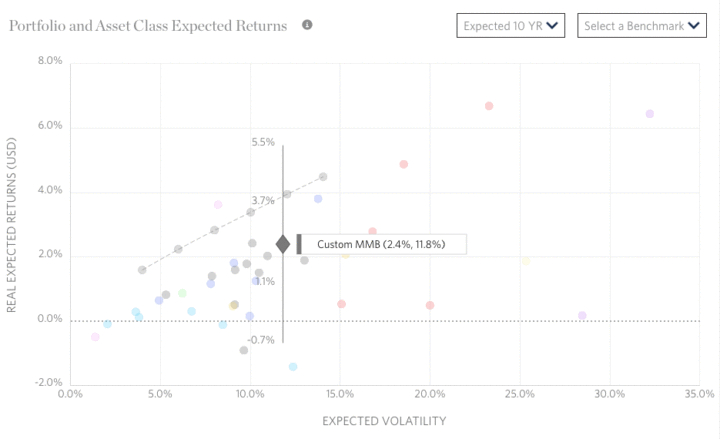
 Here’s another neat (and free!) portfolio analysis tool –
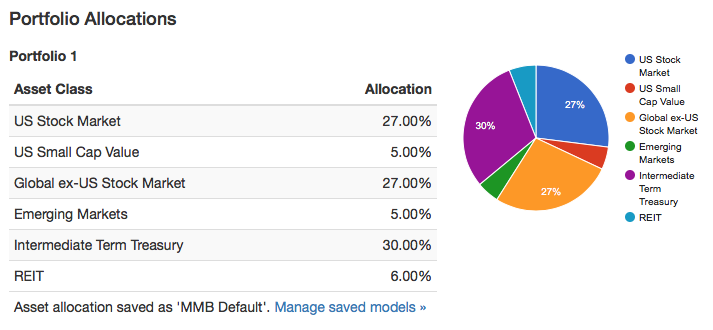

 If you haven’t gotten a dose of Jack Bogle wisdom recently, check out this

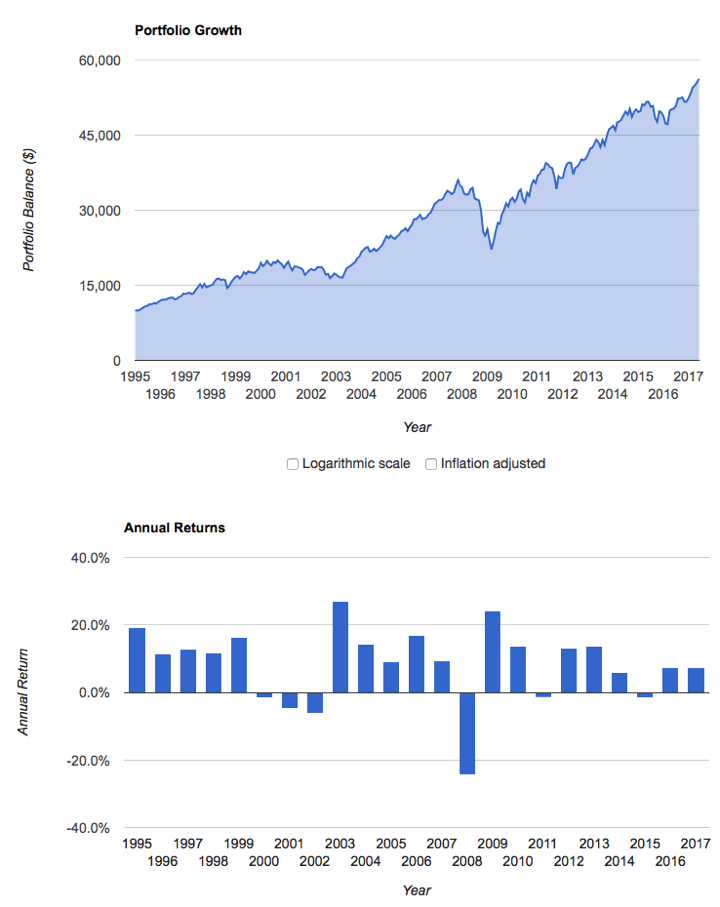
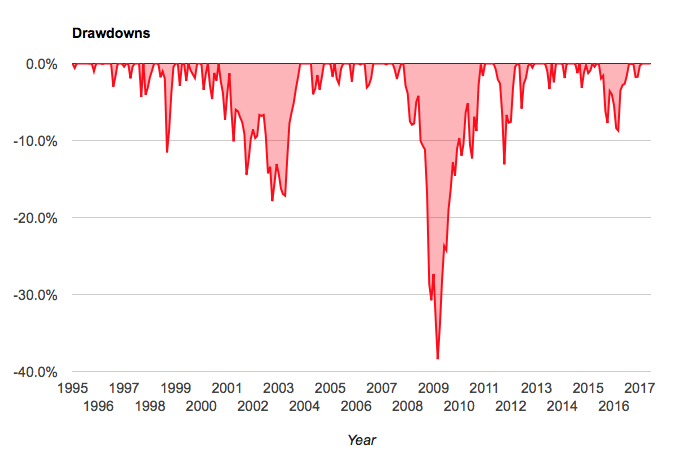
 I just noticed that PortfolioCharts.com has updated their
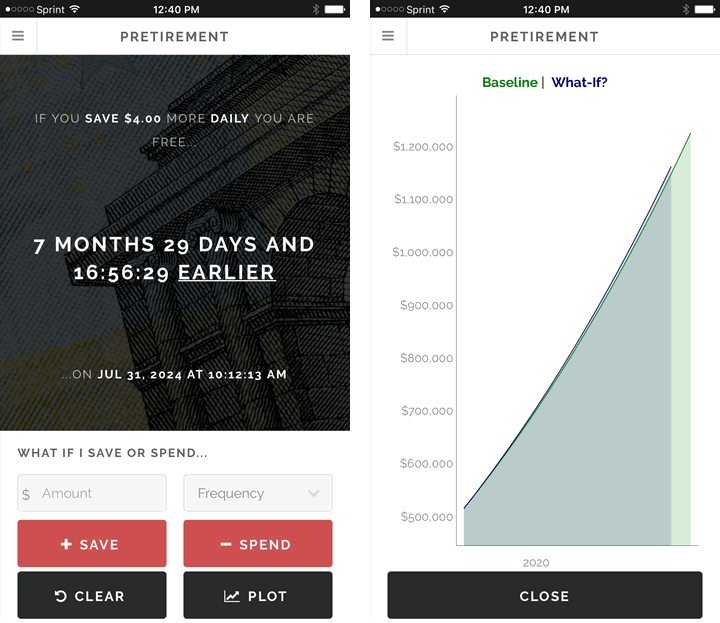
 I’ve been told that my blog isn’t personal enough. Father’s Day seemed like an appropriate time to share how our efforts towards financial freedom have altered our day-to-day lives.


 As we stand today in early 2017, the performance of the US stock market since 2009 has been pretty impressive with only a few minor hiccups. I am not calling a market drop, but the best time to prepare is before an emergency or crisis occurs. Humans have a well-documented
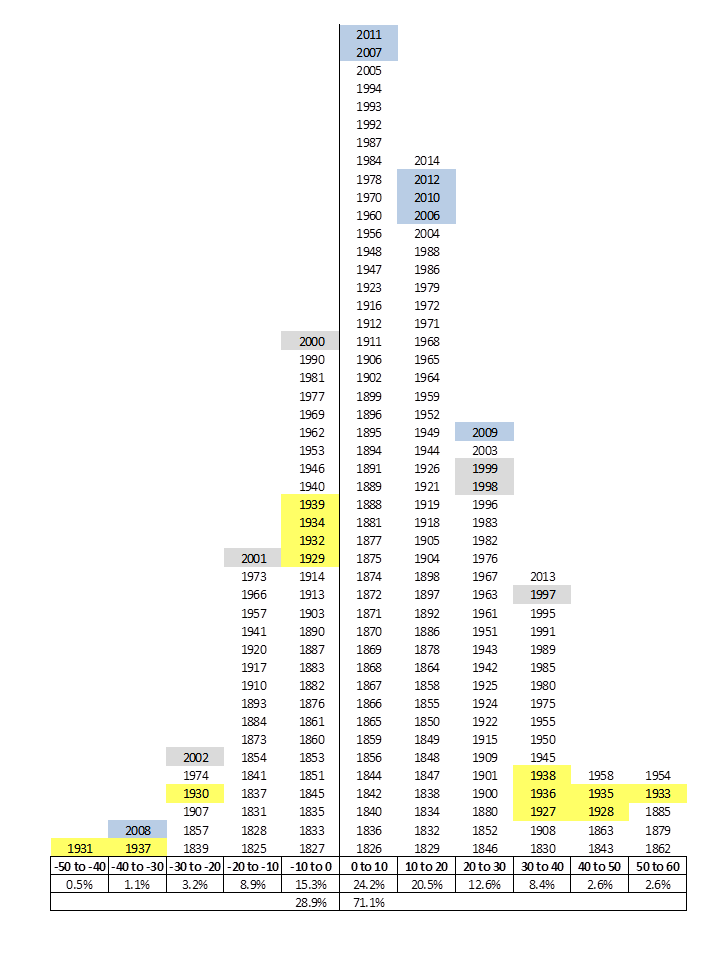

 Allan Roth has a new ETF.com article called
  The Best Credit Card Bonus Offers – 2026
 Big List of Free Stocks from Brokerage Apps
 Best Interest Rates on Cash - 2026
 Free Credit Scores x 3 + Free Credit Monitoring
 Best No Fee 0% APR Balance Transfer Offers
 Little-Known Cellular Data Plans That Can Save Big Money
 How To Haggle Your Cable or Direct TV Bill
 Big List of Free Consumer Data Reports (Credit, Rent, Work)