
Credit Card Debt
In the past, I have taken money from credit cards at 0% APR and placed it into online savings accounts or similar safe investments that earn 4-5% interest or more, and keeping the difference as profit. I even put together a series of step-by-step posts on how to make money off of credit cards in this way. However, given the current lack of great no fee 0% APR balance transfer offers, I am have not been as active in this “game” recently. My credit score remains high enough that I haven’t seen any negative actions.
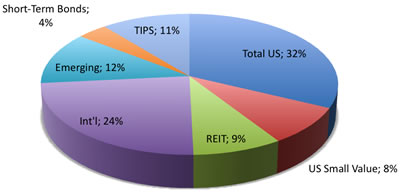
Retirement and Brokerage accounts
Markets went up, although as usual I don’t know why. I’ve been swearing off CNBC so I’m especially detached from all the buzz. Most of our retirement accounts rose about 10% the last month, which was over a $10,000 gain. I actually wish it stayed down so I could start investing some of my new cashflow at lower prices. However, waiting for it to drop again is not logical behavior, or so I keep reminding myself…
Cash Savings and Emergency Funds
We did still save a good deal of cash from our income this month, but I shifted about $10,000 of it into my brokerage account so that I can start investing in taxable accounts, which skewed the values above a bit. We still have a year’s worth of expenses in our emergency fund, which always gives me the warm fuzzies.
Home Equity
Using four different internet valuation tools – Zillow, Cyberhomes, Coldwell Banker, and Bank of America (old version) – I took the average and took off 5% to be conservative and 6% for real estate agent commissions. These sites are really wonky. Last month I was actually up, but this month my home’s estimated value dropped over $32,000 in a month. Shrug. I’m lucky that our work situation is doing well and we have no plans on moving.
According to my quick and dirty plan for financial freedom I should start paying extra towards my mortgage, but I’m having a hard time pulling the trigger on this one as well. I feel inflation coming. Should I just invest in stocks, and keep my 5% mortgage as long as possible?


 The Best Credit Card Bonus Offers – 2026
 Big List of Free Stocks from Brokerage Apps
 Best Interest Rates on Cash - 2026
 Free Credit Scores x 3 + Free Credit Monitoring
 Best No Fee 0% APR Balance Transfer Offers
 Little-Known Cellular Data Plans That Can Save Big Money
 How To Haggle Your Cable or Direct TV Bill
 Big List of Free Consumer Data Reports (Credit, Rent, Work)