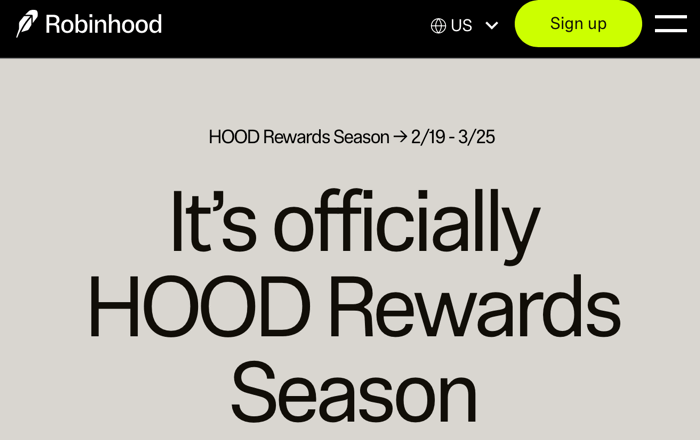
Robinhood is running “HOOD Rewards Season” from 2/19-3/25, which includes the return of some competitive account transfer bonuses. Noteworthy are the 3% total match if you have $10,000 in margin (which you can “create” beforehand) and the 2% match that includes 401k rollovers. However, note that they have very long minimum holding periods where you are stuck at Robinhood (and can’t pursue other opportunities) or they will clawback the bonus. Transfers must be initiated by March 25, 2026 to qualify.
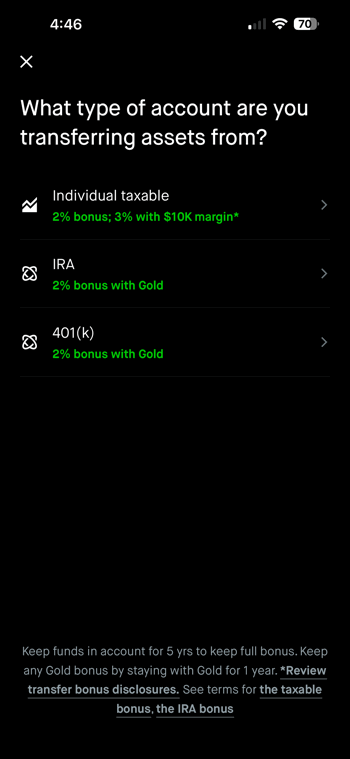
- 2% bonus on ACATS transfers to your Robinhood joint or individual taxable brokerage account from an external brokerage. 5-year minimum hold period + Robinhood Gold ($5/mo or $50/year) membership for a year required.
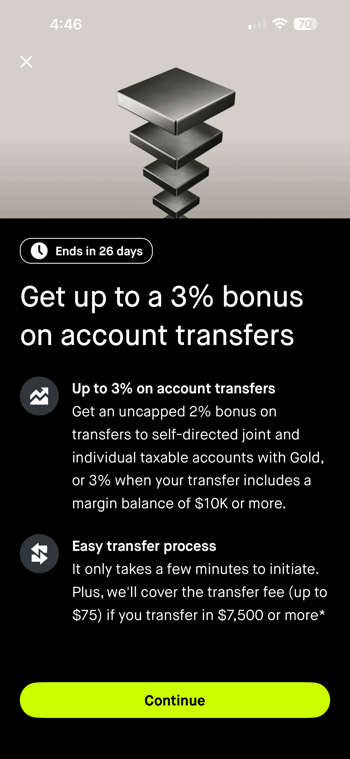
- 3% total bonus on ACATS transfers (1% extra) with a margin balance of $10,000 or more to your Robinhood joint or individual taxable brokerage account from an external brokerage.
- 2% bonus on ACATS transfers to your Robinhood IRA, including 401k rollovers. 5-year minimum hold period + Robinhood Gold ($5/mo or $50/year) membership for a year required.
- 3% bonus on IRA contributions. This is a standard offer for Robinhood Gold customers, but still worth noting if you are joining the Robinhood ecosystem. 5-year minimum hold period.
- Robinhood will also cover outgoing transfer fees (up to $75) if you transfer $7,500+ in assets.
- 2% bonus on crypto transfers. They are also announcing new products/features on March 4, 2026.
Full terms at Robinhood.com/hoodrewardstransfer.
The 2% bonus on taxable account transfers requires a subscription with Robinhood Gold ($5/mo) and customers must stay subscribed to Gold for 1 year after receiving each Gold match to keep the full Gold match. A 1% match is available to non-Gold customers, no subscription required. The funds that earned the match be kept in the account for at least 5 years to avoid a potential chargeback of the bonus. Transfer must be initiated by March 25,2026 to qualify. Offer only applies to self-directed individual or joint taxable accounts. For more information refer to Hood Season Account Transfer Bonus at robinhood.com/hoodrewardstransfer??
The additional 1% margin bonus is available to all customers who are approved for a margin account and transfer a margin balance of at least $10,000 using ACATS.
If you don’t want to move your money around all the time, I think this is a pretty good promo. If you move over a $100,000 portfolio for 5 years, that’s $3,000. If you move over a $1,000,000 portfolio for 5 years, that’s $30,000. If you have a $100,000 portfolio parked at Merrill Edge, given the upcoming Preferred Rewards changes, compare this bonus against potential cash back. Might be better to take the upfront money than to chase a higher tier. Robinhood now has over $300 billion in assets under custody.
It’s not hard to “create” a $10,000 margin balance by buying some extra SGOV/VBIL in your account right before the ACAT transfer (assuming you have enough equity collateral), do the transfer, and then pay off the margin by selling the SGOV/VBIL right after the transfer is completed. You’ll just pay a little margin interest in the meantime, should be less than $10 as your SGOV/VBIL will earn interest as well (price should increase in interim if no dividend distribution). Robinhood wants investors that use margin, as they tend to be more profitable.
 The Best Credit Card Bonus Offers – 2026
 Big List of Free Stocks from Brokerage Apps
 Best Interest Rates on Cash - 2026
 Free Credit Scores x 3 + Free Credit Monitoring
 Best No Fee 0% APR Balance Transfer Offers
 Little-Known Cellular Data Plans That Can Save Big Money
 How To Haggle Your Cable or Direct TV Bill
 Big List of Free Consumer Data Reports (Credit, Rent, Work)