As the US stock market keeps going up, it feels like everyone is whispering the same thing: We are near a top. It’s easiest to do this with numbers. Here’s a valuation metric that divides the price of the S&P 500 stock index by the median US hourly wage. In other words, how many hours of work does it take to buy a unit of the S&P 500?
Answer: More hours of work than even at the top of the 2000 tech bubble. Found via WSJ Daily Shot newsletter and @ReutersJamie. Original source appears to be BAML (Bank America/Merrill Lynch).
This concerns me of course, but I’m still a buy-hold-and-rebalance investor at roughly 2/3rd stocks and 1/3rd bonds. Sure, we might be at the top. But we could be at new top next week. There are two only possible states: all-time high or drawdown. Here’s a wise observation by @ClementsMoney:
The good news is, many investors are prepared for a stock market decline. The bad news is, they’ve been prepared since 2011.

 Here’s another neat (and free!) portfolio analysis tool –
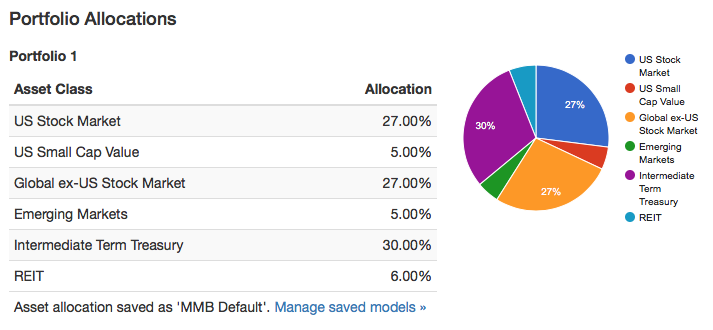

 If you haven’t gotten a dose of Jack Bogle wisdom recently, check out this

 I just noticed that PortfolioCharts.com has updated their


 Instead of watching the entire 6-hour Berkshire Hathaway (BRK) annual shareholder’s meeting, I first read through the
  The Best Credit Card Bonus Offers – 2026
 Big List of Free Stocks from Brokerage Apps
 Best Interest Rates on Cash - 2026
 Free Credit Scores x 3 + Free Credit Monitoring
 Best No Fee 0% APR Balance Transfer Offers
 Little-Known Cellular Data Plans That Can Save Big Money
 How To Haggle Your Cable or Direct TV Bill
 Big List of Free Consumer Data Reports (Credit, Rent, Work)