Updated and revised 2013. You often hear that stock investing is a sure thing over the “long run”. But as this chart from the NY Times and Crestmont Research shows, there is still a lot of variability involved. The matrix below visually displays the annualized returns for the S&P 500 for every starting and ending year from 1920 to 2010, adjusted for inflation, taxes, and transaction costs.

(click to enlarge)
Your actual returns depend a lot upon when you start, and also when you finally withdraw:
After accounting for dividends, inflation, taxes and fees, $10,000 invested at the end of 1961 would have shrunk to $6,600 by 1981. From the end of 1979 to 1999, $10,000 would have grown to $48,000.
“Market returns are more volatile than most people realize,” Mr. Easterling said, “even over periods as long as 20 years.”
Some further observations:
[Read more…]

 Yesterday, I posted a
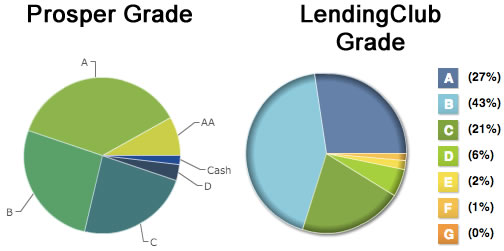
  I invested $10,000 into person-to-person loans in November 2012, split evenly between
 I’ve written about how recent fee disclosure requirements for 401(k) retirement plans have brought a spotlight on

 I’ve read a few books about dividend investing and remain interested in the idea, although I’m not confident enough (yet?) to allocate my portfolio that way. Portfolio manager and writer Mebane Faber has a short book called
  Along with other factors, new fee disclosure requirements for 401(k) plans have brought a lot of attention recently on “bad” 401(k) plans. These are plans with little or no employer match, higher-than-average fees, and/or limited investment choices.
 The Best Credit Card Bonus Offers – 2026
 Big List of Free Stocks from Brokerage Apps
 Best Interest Rates on Cash - 2026
 Free Credit Scores x 3 + Free Credit Monitoring
 Best No Fee 0% APR Balance Transfer Offers
 Little-Known Cellular Data Plans That Can Save Big Money
 How To Haggle Your Cable or Direct TV Bill
 Big List of Free Consumer Data Reports (Credit, Rent, Work)